Introduction
Plasma, often referred to as the fourth state of matter, distinct from the solid, liquid, and gaseous states is estimated to make up about 99% of the visible universe. Plasma is a collection of positively charged ions, negatively charged electrons, and neutral particles exhibiting collective behaviour and forming an overall electrically neutral system. In space, the dominant plasma formation mechanism is photoionization, in which high-energy solar radiation ionizes neutral atoms and molecules. The ionosphere, lightning, and fire represent classic natural plasma phenomena on Earth. Heating a gas to very high temperatures in the laboratory can ionize it and create a plasma. Plasmas play a critical role in semiconductor fabrication, enabling processes such as PECVD and etching. The primary challenge in plasma-based industries, particularly in semiconductor manufacturing, is achieving process repeatability and uniformity at nanoscale dimensions. This challenge is addressed by measuring key plasma parameters, with plasma diagnostic tools playing a central role in enabling accurate parameter measurement and ensuring industrial process repeatability.
Langmuir Probe as Plasma Diagnostic Instrument
While numerous plasma diagnostic tools exist—including emissive probes, magnetic probes, plasma spectroscopy, mass spectrometry, Thomson scattering, and X-ray framing camera —Langmuir Probes (LPs) remain the focus due to their direct, quantitative measurement of some important parameters across space, lab, and industrial plasmas. LPs are essential diagnostic tools in plasma physics for measuring parameters like electron density ( ), temperature , and plasma potential . LPs are commonly designed in spherical and cylindrical shapes. Cylindrical probes are generally preferred for laboratory chamber plasmas. LPs are extensively used in GEC (Gaseous Electronics Conference) reference cells, which are standardized RF plasma chambers for reproducible plasma processing research. LPs are employed across a wide range of plasma systems, including inductively coupled plasmas (ICP), capacitively coupled plasmas (CCP), as well as plasma-based sputtering, etching, and deposition processes. Additionally, in pulsed and laser-produced plasmas, temporal measurements are essential for understanding plasma generation and decay dynamics over short time scales.
Spherical LPs are commonly used for space plasma measurements and integrated into satellites for direct plasma measurements in orbit. Real-world examples include Rosetta spacecraft’s two identical Langmuir probes (LAP1 and LAP2), which differ only in their deployment boom lengths (2.24 m vs. 1.62 m), measuring plasma properties along its trajectory and around comet 67P/Churyumov–Gerasimenko, and Cassini’s Langmuir probe, which characterized plasma environments around Saturn and its moons. Spherical LPs enable isotropic collection, attracting ions and electrons uniformly from all directions due to their symmetric geometry. In contrast, cylindrical LPs feature elongated, slender collectors with lengths much greater than their radii, leading to predominantly radial particle collection.
Working Principle of Langmuir Probe
The Langmuir probe is connected to an external electrical circuit where a precisely controllable bias voltage is applied relative to the grounded plasma chamber, which serves as the reference or zero potential for the system. By varying this applied bias voltage, the electrical potential of the probe is altered with respect to the surrounding plasma environment. This controlled change in probe potential governs the interaction between the probe and charged species in the plasma, enabling the probe to selectively attract or repel particles depending on their charge. When the probe is biased at a negative potential, it repels negatively charged electrons while preferentially attracting and collecting positively charged ions. Conversely, when the probe is biased positively, it attracts electrons toward the probe surface while repelling positive ions.
As a consequence of this interaction between the probe and the plasma, an electrical current flows through the probe and the associated measurement circuit. Rather than measuring this current directly, it is determined indirectly by monitoring the voltage drop across a resistor of known resistance that is connected in series with the probe. Applying Ohm’s law, the probe current is calculated using the measured voltage drop and the known resistance value. By systematically sweeping the probe bias voltage over a range of negative and positive values and recording the corresponding probe current at each voltage step, a complete current–voltage (I–V) characteristic of the plasma is obtained. Detailed analysis of this I–V characteristic allows for the extraction of key plasma parameters, including the electron temperature, electron density, ion saturation current, and plasma potential, thereby providing valuable insight into the fundamental properties of the plasma.
Need and Types of Simulation Tools for Langmuir Probe Studies
The need for simulation, especially in the context of Langmuir probes and plasma diagnostics, arises because real experiments can be complex, costly, time-consuming, and sometimes risky. Simulation helps us understand, predict, and optimize plasma behaviour without always having to physically test it. To achieve these goals, several types of simulators are used in plasma diagnostics and Langmuir probe studies. Electromagnetic (EM) simulators solve Maxwell’s equations to model the electric and magnetic fields within the plasma, making them particularly useful for analysing plasma interactions. Circuit simulators solve the differential equations of connected circuits using Kirchhoff’s laws, allowing accurate prediction of voltages and currents, including those applied to Langmuir probes, and helping understand plasma-circuit interactions. Finally, behavioural or reduced-order simulators employ model-based approaches, such as tables, transfer functions, or equivalent circuits, to quickly approximate plasma or probe responses, enabling fast design iterations and system-level studies without solving the full physical equations.
Ansys Charge Plus – an EM based tool stand out for plasma simulations due to their ability to solve Maxwell’s equations directly [1]. Ansys Charge Plus integrates Multiphysics solvers, including electromagnetic, particle, fluid, and chemical reaction models into a seamless interface. Engineers can use GPU to accelerate Ansys Charge Plus simulations, enabling rapid design iterations and swift result analysis. In this article, the Ansys Charge Plus tool is used to simulate the Langmuir probe. The various stages involved in setting up and executing the simulation are discussed in the following section.
Pre-Processing and Material Assignment
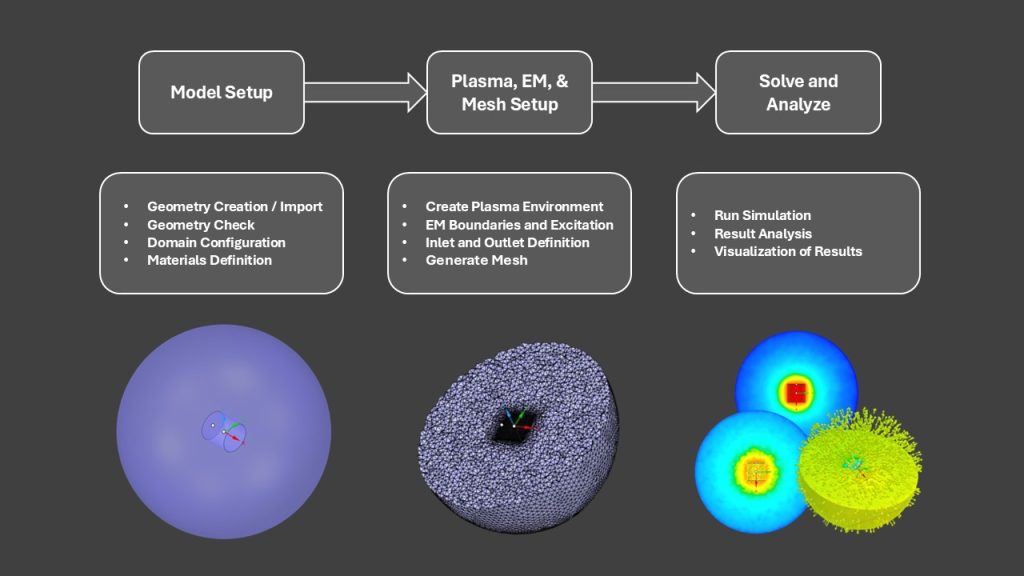
The Langmuir probe simulation workflow begins with model setup, where the probe geometry is either created directly or imported from CAD files and then checked for any geometry errors. Ansys Charge Plus is embedded within Ansys Discovery. Ansys Discovery supports a wide range of CAD import formats such as STEP and STL [2]. Ansys Discovery provides powerful and intuitive geometry-editing tools, making it well suited for cleaning, repairing, and preparing CAD models prior to simulation [3]. In this article, the geometry is created using design tab features. The Langmuir probe is designed as a cylindrical geometry, while the surrounding plasma region is represented by a sphere enclosing the probe. Once the geometry is defined, the solver is configured in the Charge tab by selecting Plasma Dynamics, defining appropriate time stepping, and enabling PIC options to ensure accurate representation of plasma density.
Ansys Charge Plus allows users to assign materials either from its built-in material libraries or by creating and modifying custom materials. Custom material definitions can be configured by editing properties such as dielectric constant, electric bulk conductivity, atomic mass, atomic number, and bulk material density. In the present simulation, vacuum is selected from the material library and assigned to the spherical region representing the plasma region.
Plasma Environment, Boundary Conditions, and Mesh Generation
Ansys Charge Plus supports both predefined plasma environments available in its built-in library and the creation of fully custom plasma definitions. The library includes environments such as Argon–Low Energy, Argon–High Energy, Atmospheric Hydrogen, Atmospheric Nitrogen with varying relative humidity levels, GEO Maxwellian and Double Maxwellian models with preconfigured species and reactions. In the present simulation, a custom plasma environment is defined for the Particle-in-Cell (PIC) analysis using electrons and singly ionized argon ions (Ar⁺). A Maxwellian distribution is applied to the electrons, with their temperature specified in electron volts (eV) and density defined in N/m³, while the Ar⁺ ion species is characterized by explicitly defined temperature, density, and mass. The resulting custom plasma environment is then assigned to the simulation geometry.
Two electromagnetic (EM) boundary conditions are defined: one applied to the outer spherical plasma boundary and the other to the cylindrical probe surface inside the sphere. For the cylindrical probe geometry, a linear ramp signal should be created from the Signals section. This newly created signal is then assigned by dragging and dropping it onto the probe boundary condition to apply the voltage excitation. The environment boundary conditions include Inlet, Outlet, and Sheath options. The Inlet boundary condition allows the specification of density and velocity parameters for Particle-in-Cell (PIC) species. In this simulation, the Inlet boundary condition is applied to the outer spherical surface. Both electron and Ar⁺ ion species are selected; their density and velocity properties are defined.
Outlets are used to control the loss behaviour of PIC species at boundaries by specifying a Loss Fraction. A value of 1 indicates that particles are completely absorbed at the boundary, while a value of 0 causes particles to be either reflected or replaced in the system, depending on the selected PIC species option. Intermediate values between 0 and 1 represent partial loss of charge and mass. In this simulation, an outlet of type Density is assigned to the inner cylindrical geometry representing the probe, with the Loss Fraction set to 1 and both plasma species (electrons and ions) selected, ensuring that particles are fully absorbed by the probe. The Sheath boundary condition is not used in this simulation, as its application would override the specified Outlet boundary conditions. The Sheath boundary condition is used when an analytic sheath needs to be imposed on a specified boundary. Resolution is set and Direct Mesh Groups are used for targeted, high-fidelity meshing of geometries.
Simulation Execution and Visualization
To start the simulation, click the Start button in the Analysis section. This action exports the required files and initiates the simulation using the number of parallel processes specified in the Domain settings. Ensure that the number of parallel processes specified in the Domain settings does not exceed the number of logical processors available on your machine. Enabling “Generate Charge Results in HDF5 Format” in the Settings menu ensures that all simulation results are written to a single HDF5 file; if this option is disabled, results are generated in DAT file format. The simulation results appear in the Results section of the Simulation tree. To view them, right-click on the results and select Internal Graphite Visualization, choose the desired time steps, and then click Visualize Results to generate and display the results.
Contours are used to visualize simulation results in discovery graphite and Users can also highlight and quickly shift variables as well as easily shift time steps. Variables include PIC Density, PIC Temperature, PIC Momentum Density, PIC Charge, Energy Density, Electric Potential, Electric Field etc. In addition to visualizing results using contours, users can also generate 2D time plots which can be exported as an image. Ansys Charge Plus results can be visualized using both ParaView and EMA3D Connect, offering flexibility in analysis workflows. The simulation outputs can be exported in standard formats (HDF5), which makes them compatible with these tool/ecosystem.
Influence of Voltage Ramp Polarity on Probe–Plasma Interaction
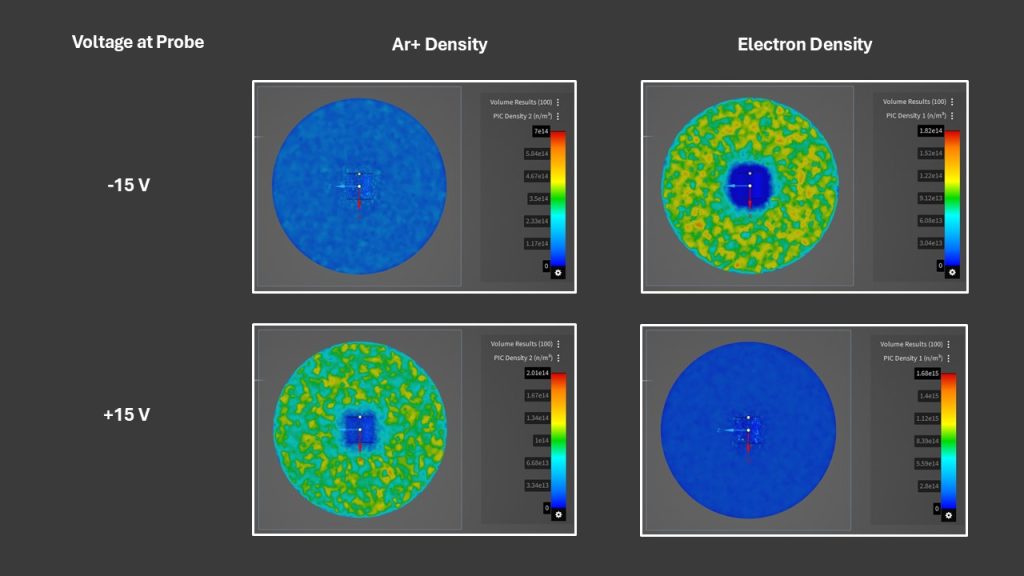
To investigate the underlying physics, the simulation examines two voltage-ramp conditions: one ramping from 0 to +15 V and another from 0 to −15 V. In the top image, the probe is negatively biased due to the 0 to −15 V ramp, causing it to attract positive argon ions while repelling electrons. In contrast, the bottom image corresponds to the 0 to +15 V ramp, where the positively biased probe attracts electrons and repels positive argon ions.
Conclusion
This article demonstrates how Ansys Charge Plus can be used to simulate a cylindrical Langmuir probe in a Maxwellian plasma environment, providing clear insight into probe–plasma interactions through an EM and PIC-based approach. The simulation workflow effectively captures field behaviour, while the voltage ramp study highlights the expected attraction and repulsion of electrons and ions based on probe bias polarity. With flexible visualization and post-processing options, this virtual diagnostic approach offers a time-efficient complement to experimental Langmuir probe measurements for both research and industrial plasma applications. Using the same simulation workflow—with only minor modifications—GEC or CCP plasma simulations can also be performed in Ansys Charge Plus.